By Robert Bard, MD, DABR, FASL; Emil Toma, MD, DSc, FRCP(C); and Danilo Buonsenso, MD
Radiology Today
Vol. 21 No. 9 P. 18
Imaging of the lung is functionally divided into outpatient, noncritical patients and acutely ill patients—or patients suspected of infectious disorders. Contagious conditions, such as COVID-19, require equipment that is easily sanitized or disposable. Handheld units and disposable gel packets are preferred in potentially contaminated circumstances.
Access to a previous or baseline scan is essential for managing outcomes. Real-time assessment of pulmonary changes allows verification of treatment and a greater choice of options, with new therapeutic protocols continually developing worldwide. Advances in image fusion afford access to real-time image-guided treatments such as thoracentesis and abscess drainage at the bedside and image-guided biopsy. High-resolution 3D measurement of pleural thickness provides prognostic guidance, since increased thickness and density signify delayed recovery.
As members of the European Society of Radiology, Sociedad Espanola de Ecografia, and the Journal of Ultrasound (Rome), the authors had a front row seat to the ongoing progression of the COVID-19 pandemic from the European front and were privileged to communicate electronically with European treating physicians since February 2020. A significant advantage of lung imaging with ultrasound—other than ease of use, portability, lack of ionizing radiation, and the ability to sanitize quickly and effectively—is the fact that CT is not a screening tool for COVID-19 pneumonia. And screening is important because 50% of patients entering the emergency department do not present with fever.1
ABCs of Lung Ultrasound
The normal findings in supine, recumbent, prone, or erect position demonstrate a lung sliding motion on B-mode with a characteristic appearance on both A-mode and M-mode. Dynamic examination may be performed for accuracy of questionable structures since the intercostal muscles will contract and expand during respiration, which can be measured by M-mode. This may be later compared with postventilation atrophy and used as a visual guide for patients to accelerate respiratory therapies.
A-lines are seen in normally aerated lungs as reverberation artifacts appearing as linear, horizontal, echogenic, smooth lines reflecting off of the intact visceral pleural lining/normal lung interface. These bright white bands are displayed and repeated uniformly in evenly spaced intervals from the pleural line to the bottom of the image. A-lines disappear as lung pathology increases and reappear as the pulmonary parenchyma/pleural interface normalizes. These physiologic appearances vary with transducer selection, probe placement, angulation, and respiratory dynamics.
Sonographic patterns of these artifact reverberations are termed B-lines. They are hyperechoic linear echoes arising from the pleural line, extending vertically to the bottom of the image. These dynamic artifactual lines are generated by increased or accumulated interstitial fluid and often appear at the lung bases or diaphragmatic-pleural interface in elderly or bedridden patients as an incidental finding, if there are no more than two in a particular field of view. The radiologic CT correlation of B-lines generated by interstitial disease is the “lung rocket” and the radiographic image of alveolar fluid correlates with the ground glass opacity (GGO) finding best seen on high-resolution CT.
B-lines may be present as single, multiple, or confluent filling the entire screen. Often, the pleural line will be less echogenic and thickened or irregular. To best appreciate B-lines, one follows the A-lines until they disappear or maps the B-lines until the A-lines reappear. This is advisable to more clearly evaluate abnormal pleural findings, as the comparison is distinct.
Lung sliding is visible during physiologic respiration as a to-and-fro or back-and-forth movement. The margin of the pneumothorax—the point of visceral pleural separation from the parietal pleura—with the normal lung is called the lung point, at which location the sliding motion ceases. Presence of a lung point indicates that air or pneumothorax is absent in the scanned region. Emergency image interpretation based on the presence of lung sliding starts with the presence or absence of this sign. If present, we uniformly look at the B-line profile for pulmonary edema or the A-line profile to see whether deep vein imaging is indicated to find thrombosis leading to pulmonary embolism.
Normal venous imaging suggests the presence of pneumonia or COPD or asthma. Abolished lung sliding indicates observation of the B-line profile for pneumonia or the A-line profile to check for a lung point indicating pneumothorax. Absent sliding without lung point requires further diagnostic modalities. Pneumonia may show A-lines, B-lines, or C-lines—microechoes—in any pattern, depending on the area insolated by a particular probe.2
Lung pulse is the rhythmic pulsation of the pleura with adjacent cardiac contraction, which may be observed with greatly diminished respiratory excursion. The presence of intermittent C-lines indicates absence of pneumothorax.
Indications for pleural ultrasound include, but are not limited to, the following:
• dyspnea;
• evaluation for the presence, size, and complexity of pleural effusions;
• evaluation for the presence of hemothorax;
• evaluation of the thickness and irregularity of the pleural line;
• suspicion of interstitial lung disease;
• evaluation of pneumothorax; and
• determination of the lung point.
Pleural disorders in the near field are best scanned with the linear probe, while deeper effusions are better imaged with the curved or phased array probes. The probe angle should be adjusted to a true perpendicular plane to the pleural interface. The pleural line or visceral pleura/lung interface is the starting location for lung diagnosis, and the presence of artifacts from other acute or chronic pulmonary disorders may appear as “comet tail artifacts” that arise from pleural pathologies. These may be difficult to distinguish from B-lines but are usually associated with parietal or visceral pleural thickening, best appreciated with the linear probe or the higher-resolution 3D/4D volumetric transducers.
Signposts
In the COVID-19 lung, the pleural line may be irregular and fragmented or interrupted and thickened. In patients with COPD or collagen/interstitial diseases, the comet tail sign is generally associated with a smooth pleural line. Pleural and subpleural hypoechoic regions or small foci of echo-free pleural effusion indicate that the disease is worsening. In general, inflammatory pleura is thicker and more irregular than noninflamed pleural surfaces.3 The B‐line pattern may be present in, but not specific to, cardiogenic and noncardiogenic pulmonary edema. The thickness of the pleura and the location of the B‐line pattern may aid in the differentiation of these two disease processes.4-8
The air situated between the pleural surfaces creates the absence of lung sliding, A-lines, B-lines, and lung pulse. The presence of a lung point further indicates a focal air collection with a predictive negative value approaching 100%. The finding of lung sliding or C-lines is 100% sensitive for the exclusion of pneumothorax present at a given interspace. Multiple rib interfaces should be examined if the suspicion of pneumothorax is high. A small apical pneumothorax may be missed because of shadowing from bone.
Flat patient positioning—prone or supine—is preferred. If the presence of lung sliding is unclear in a patient with a high pretest probability, a further evaluation should be performed. Scans may be used concomitantly to monitor the position of a central venous catheter without the use of a confirmatory X-ray.
Interstitial syndrome is caused by pulmonary edema, interstitial pneumonia or pneumonitis, pulmonary fibrosis, acute respiratory distress syndrome (ARDS), and diffuse parenchyma lung disease. It is a condition where alveolar aeration is impaired due to an increase in fluids in the pulmonary interstitium, with some lung aeration preserved. B-lines are found in interstitial syndrome, where excess fluid in the alveoli is adjacent to the pleural surface and creates linear, artifactual, vertical lines—comet tails or rockets—originating from the pleural line and extending to the bottom of the scan field, which tend to move with the lung sliding. Multiple lines—greater than two per field are considered pathologic—correlate with the presence of extravascular lung water. They disappear when fluid is removed by diuretics or dialysis and obliterate the normal A-line pattern.
In pulmonary edema, the B-lines tend to be diffusely homogeneous, usually bilateral, take up most of the lung surface, and do not have skip areas when imaged. The distribution of B-lines also correlates with CT signs of fibrosis, and lung sliding may be decreased due to the restrictive pulmonary process. B-lines in parenchymal lung disease are associated with pleural line abnormalities and subpleural abnormalities.
ARDS images include anterior subpleural consolidations, reduction of lung sliding, “spared” areas of normal pulmonary parenchyma, nonhomogeneous B-line distribution, and pleural line abnormalities. In severe cases, the confluence of B-lines may produce a whiteout effect that must be differentiated from lung consolidation. Diffuse interstitial pneumonia shows nonhomogeneous B-line distribution, areas of spared lung and subpleural consolidations, foci of frank pulmonary consolidation, and pleural line abnormalities.9-12
Atelectasis—collapsed lung—is seen in many conditions but is uncommon in COVID-19 without pleural effusion. This is more common in patients who are postoperative, bedridden, or debilitated from diabetic or oncologic disorders. Lung sliding may be absent because the alveoli are not ventilated, due to decreased or compressed lung volume and upward diaphragmatic dome displacement.
In the case of complete atelectasis, echogenicity is similar to liver parenchyma—lung hepatization—except for hyperechoic foci from partially aerated bronchioles. In infants, dystelectasis from partial collapse is more common. The clinician may be able to differentiate between atelectasis and pneumonia causing the consolidation process. This is a clinical distinction, but the presence of mobile/dynamic air bronchograms indicates a bronchus that is patent.
Prognostic Considerations
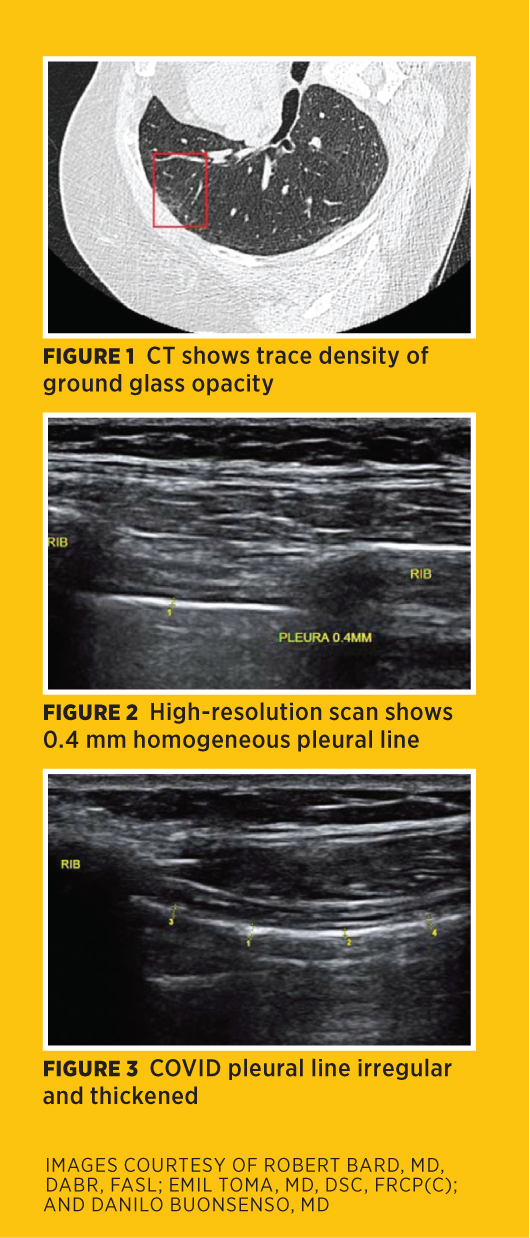
Prognostication of severity and mortality risk may be based on a CT scoring system of time from disease progression to resolution and the percentage of pulmonary parenchyma involved with Grade 1—less than 5%—to Grade 5—more than 75%—for GGO, crazy-paving pattern, and consolidation (Figure 1). Idiopathic pulmonary fibrosis presents with subpleural consolidations and nonhomogeneous B-line distribution. Survivors are experiencing either new organ system disorders or complications of ventilator dependency and pulmonary fibrosis.
CT and ultrasound are useful in the investigation of these disorders and in follow-up of potentially chronic conditions. While lung CT abnormalities attain greatest severity approximately 10 days after onset of symptoms and tend to reduce after 14 days during the absorption phase, with patients achieving normal living ability by approximately two months after onset, CT findings may remain apparent. CT images in the early recovery phase show reduction of GGO and reduced consolidation, but pulmonary fibrosis appears as fibrous shadows such as fibrous stripes, subpleural lines, and traction bronchiectasis in multiple lung lobes. This finding has been documented previously in severe acute respiratory syndrome patients discharged after treatment. One can follow up fibrosis with nonradiation imaging, such as chest wall elastography and diaphragmatic ultrasound, to compare with clinical respiratory evaluation.
In the months following patients with minimal CT images, the clinical symptoms in some patients progress due to a chronic fibrotic response, even as the imaging findings improve. This makes the pleural findings an important parameter and suggests initial and serial follow-up with noninvasive high-resolution 3D ultrasound with elastographic scanning. The normal pleural thickness at 18 MHz linear transducer imaging is 0.3 mm to 0.5 mm, and the normal pleural echo may be inhomogeneous due to the expected respiratory motion and the A-lines having similar features (Figure 2). A pathologically thickened pleura line is optimally imaged with a 3D 17 MHz linear probe or 18 MHz convex probe (Figure 3).
The diaphragmatic pleural interface is important, since most pathology is found in this area. B-line activity occurs in recumbent positions or in elderly patients, so the pleural thickness is helpful in determining disease aggression. A thin pleural line with good respiratory excursion suggests healthy tissues. Inflammatory or neoplastic hepatic or splenic disorder may cause attenuation through the glands and abnormal findings at the parenchymal/pleural interface.13-17
Tissue density imaged by elastography has been performed on the liver, breast, prostate, thyroid, and skin for many years with high accuracy. Desmoplastic tumors and inflammatory fibrosis alter the elastic modulus and are measured on the color-coded side bar. Since the degree of pleural thickening is roughly proportional to the length of recovery, a study may be performed using this technology as a surrogate marker for future treatment assessment.18
Multimodality Assessment
Antibody testing may have a role when COVID-19 is strongly suspected in patients with a reverse transcription polymerase chain reaction (RT-PCR)-negative result at more than two weeks from symptom onset. Chest imaging findings are, however, variable. CT scan was proposed at the beginning of the COVID-19 pandemic as an appropriate, if not the best, imaging examination for the diagnosis and management of the disease. A review of the typical and atypical CT findings and their variability was published earlier this year by Xu and colleagues in European Radiology; although chest CT has a high sensitivity of up to 97%, especially at the earlier phases of infection, its specificity is quite low, being about 25%.
Therefore, CT alone is not recommended by the Centers for Disease Control and Prevention, the ACR, or the National Institutes of Health for the diagnosis of COVID-19, either as a screening, first-line test, or at follow-up. In addition, serial examinations are often needed, especially in severe cases, both during hospitalization and for long-term follow-up for possible sequels. This raises concerns about cumulative radiation and, therefore, the need for other imaging approaches. Moreover, point-of-care technologies allowing for rapid diagnostic information are extremely important. In fact, the presence of pleural thickening, confirmed by autopsy, is more often encountered than pleural effusion in patients with COVID-19, being reported in 32% and 5% of cases, respectively, according to the review by Xu and colleagues.
It is estimated that a significant proportion of patients with severe forms of COVID-19, especially those surviving mechanical ventilation, develop pulmonary fibrosis. Although several abnormal immune mechanisms promote pulmonary fibrosis, diffuse alveolar damage is the main factor. Several studies have found that diffuse alveolar damage is the predominant histologic finding in postmortem biopsies.
Fibroblast proliferation and fibrin-forming clusters in the alveolar spaces lead to consolidation and even fibrotic organizing pneumonia. Increased stromal cells, infiltration by mononuclear inflammatory cells, and atypical proliferation of type 2 pneumocytes will cause thickening of alveolar walls and interstitial thickening. Mechanical ventilation will add further lung injury with progression to widespread fibrotic changes. It is, therefore, important to diagnose the occurrence of pulmonary fibrosis and serially follow the outcome by a noninvasive imaging technology that does not use ionizing radiation.19
Variable accuracy of the RT-PCR test results means pleural imaging findings are clinically significant because a thicker line correlates with a worse prognosis. A thickened pleural line with rare pleural effusions is characteristic of COVID-19 inflammation. 3D high-resolution ultrasound provides distinct depth measurements that are serially followed as a nonionizing substitute for CT. Point-of-care ultrasound is now replacing CT as the initial imaging study and serial follow-up modality.
— Robert Bard, MD, DABR, FASL, has pioneered digital imaging technologies since 1972 and is a member of leading international imaging societies.
— Emil Toma, MD, DSc, FRCP(C), is a full clinical professor in the department of microbiology, immunology, and infectious diseases at the University of Montreal, Canada.
— Danilo Buonsenso, MD, is a practicing pediatrician from Gemelli University Hospital in Italy.
References
1. Lung ultrasound in patients with Covid-19 Disease. AIUM website. https://connect.aium.org/events/event-description?CalendarEventKey=f7656519-8273-4a44-8dbc-9b8838b3c66c&Home=%2Fevents%2Fcalendar
2. Volpicelli G, Elbarbary M, Blaivas M, et al. International evidence‐based recommendations for point‐of‐care lung ultrasound. Intensive Care Med. 2012;38(4): 577-591.
3. Koenig SJ, Narasimhan M, Mayo PH. Thoracic ultrasonography for the pulmonary specialist. Chest. 2011;140(5):1332-1341.
4. Lichtenstein DA, Menu Y. A bedside ultrasound sign ruling out pneumothorax in the critically ill: lung sliding. Chest. 1995;108(5):1345-1348.
5. Lichtenstein D, Mezière G, Biderman P, Gepner A. The “lung point”: an ultrasound sign specific to pneumothorax. Intensive Care Med. 2000; 26(10):1434-1440.
6. Lichtenstein D, Mezière G, Biderman P, Gepner A, Barré O. The comet‐tail artifact: an ultrasound sign of alveolar‐interstitial syndrome. Am J Respir Crit Care Med. 1997;156(5):1640-1646.
7. Copetti R, Soldati G, Copetti P. Chest sonography: a useful tool to differentiate acute cardiogenic pulmonary edema from acute respiratory distress syndrome. Cardiovasc Ultrasound. 2008;6:16.
8. Agricola E, Bove T, Oppizzi M, et al. “Ultrasound comet‐tail images”: a marker of pulmonary edema — a comparative study with wedge pressure and extravascular lung water. Chest. 2005;127(5):1690-1695.
9. Lichtenstein DA, Mezière GA, Lagoueyte JF, Biderman P, Goldstein I, Gepner A. A‐lines and B‐lines: lung ultrasound as a bedside tool for predicting pulmonary artery occlusion pressure in the critically ill. Chest. 2009;136(4):1014-1020.
10. Lichtenstein DA, Mezière GA. Relevance of lung ultrasound in the diagnosis of acute respiratory failure: the BLUE protocol. Chest. 2008;134(1):117-125.
11. Lichtenstein DA, Lascols N, Mezière G, Gepner A. Ultrasound diagnosis of alveolar consolidation in the critically ill. Intensive Care Med. 2004;30(2):276-281.
12. Zanobetti M, Poggioni C, Pini R. Can chest ultrasonography substitute standard chest radiography for evaluation of acute dyspnea in the emergency department? Chest. 2011;139(5):1140-1147.
13. Balik M, Plasil P, Waldauf P, Pazout J, Fric M, Otahal M, Pachl J. Ultrasound estimation of volume of pleural fluid in mechanically ventilated patients. Intensive Care Med. 2006;32(2):318.
14. Remerand F, Dellamonica J, Mao Z, et al. Multiplane ultrasound approach to quantify pleural effusion at the bedside. Intensive Care Med. 2010;36(4):656-664.
15. López Vega JM, Parra Gordo ML, Diez Tascón A, Ossaba Vélez S. Pneumomediastinum and spontaneous pneumothorax as an extrapulmonary complication of COVID-19 disease. Emerg Radiol. 2020:1-4.
16. Bard R, Hassani N. Crescent sign in pulmonary hematoma. Respiration. 1975;32(3):247-251.
17. Bard R, Hassini N. Pneumomediastinum complicating pregnancy. Respiration. 1975;32(2):185-188.
18. Zhang B, Arola DD, Roys S, Gullapalli RP. Three-dimensional elastic image registration based on strain energy minimization: application to prostate magnetic resonance imaging. J Digital Imag. 2011;24(4):573-585.
19. George PM, Wells AU, Jenkins RG. Pulmonary fibrosis and COVID-19: the potential role for antifibrotic therapy. Lancet Respir Med. 2020;8(8):807-815.